In this chapter, we will take a closer look taking a closer look at quality control methods for library preparations. Quality control measures ensure that your library preparations are as good as can be before you venture to sequencing. As described in our previous chapters, commonly used library preparation methods involve PCR amplification steps to complete the adapter sequences, introduce indices and amplify the final library to a level that allows quantification and quality control using dedicated devices. Quality control aims to accurately determine the library profile, size distribution, and concentration for loading the sequencer. Most experiments aim for an equal read distribution between all samples to ensure comparability of the samples in later analysis. Even though many data analysis tools use normalization prior to the comparison of sample groups, larger differences in read-depth between the groups can cause various unexpected effects. To avoid these complications, equal read distribution is the gold-standard for most RNA-Seq experiments and accurate quantification of the libraries a prerequisite.

1. Quality Control Methods
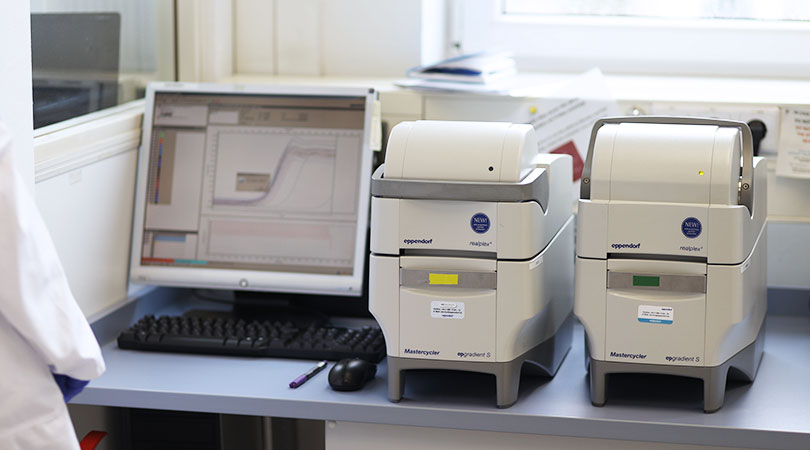
The analysis of a small volume of the amplified library with microcapillary electrophoresis has become standard practice for NGS laboratories. Electrophoresis / microfluidics platforms are available from various manufacturers, e.g., Bioanalyzer, Fragment Analyzer, LabChip GX II, or TapeStation. The traces generated on these machines deliver information about the library quantity, size distribution, shape, and the presence of undesired by-products or residual primers (Fig. 1).
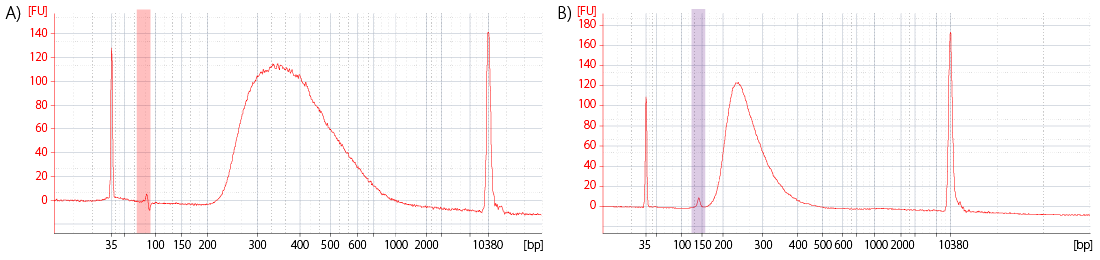
Figure 1 | Bioanalyzer traces of final RNA-Seq Libraries. A) Library with residual primers after the final purification step, highlighted in red. B) Library with adapter dimer (alternative: linker-linker) by-product after the final purification step, highlighted in purple.
In case substantial by-products are visible (e.g., by-products accounting for > 3 % of the final library preparation), it is best to remove them by re-purifying the final lane mix prior to sequencing. As shorter fragments are preferentially amplified, the by-products can otherwise take up a significant amount of sequencing space and reduce the number of useful sequencing reads obtained from an NGS experiment.
Which of these machines is used for library quality control often depends on the needs and sample throughput of the individual laboratory, e.g., Bioanalyzer is a chip-based system with the capacity to analyze 11-12 samples per run while Fragment Analyzer is plate-based and can handle multiple 96-well plates per run making it the go-to solution for high-throughput NGS laboratories with large-scale projects. In addition, the machines differ in their resolution, sensitivity, and dynamic range. While all of them can be used for library QC, input requirements and the appearance of the library trace will vary between instruments (Fig. 2).
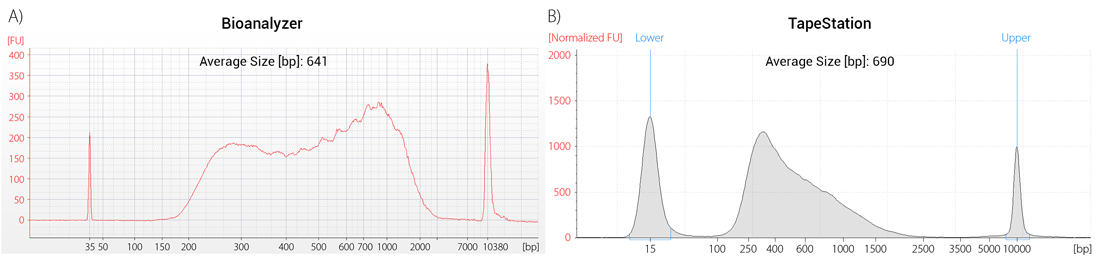
Figure 2 | Machine-specific appearance of library traces. Aliquots of the same library were run on a Bioanalyzer High Sensitivity DNA Chip (A) and on a TapeStation High Sensitivity D5000 ScreenTape (B).
While microfluidic devices offer thorough information on the relative size distribution and presence or absence of side-products, these methods should be combined with a sensitive quantification assay for more accurate results. For example, library quantification can be performed using benchtop fluorometers with an assay for highly sensitive DNA quantification, e.g., the Qubit dsDNA HS assay is often used.
2. qPCR for Accurate Quantification of Amplifiable Fragments
More accurate library quantification can be achieved with qPCR assays. With these assays, the relative or absolute abundance of amplifiable fragments contained in a ready-to-sequence library is assessed. The qPCR assays use specific primers targeting the adapter regions only present in fully functional library molecules. Thereby, only the fraction of library molecules that are correctly assembled and amplifiable is assayed. The concentration of these fragments is then calculated by comparing Cq or Ct values to a set of known standards (Fig. 3).
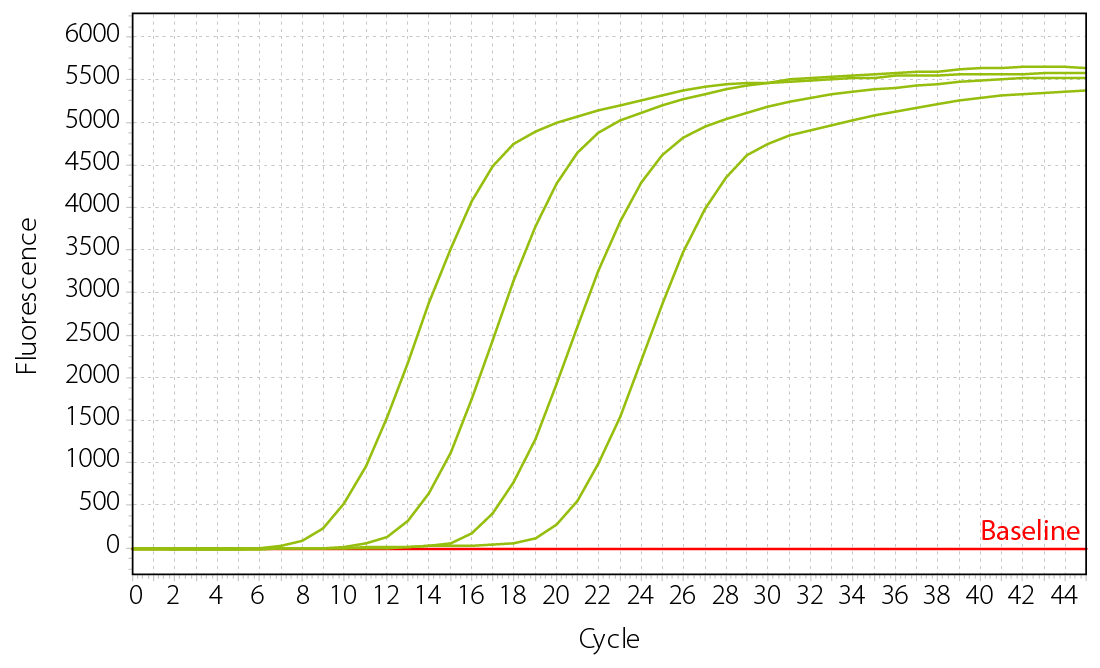
Figure 3 | Library quantification assay using qPCR based on known standards. Standards with defined concentration are assayed in parallel to the libraries to determine the concentration of the unknown libraries. Standard curves are shown (from left to right: high concentrated to low concentrated standard).
The Cq value or “quantification cycle value” is defined as the number of cycles required for the fluorescent signal to exceed the background fluorescence during a qPCR reaction. This value is also referred to as Ct (“threshold cycle”), Cp (“crossing point”) or TOP (“take-off point”).
Even though fluorescent dyes used in qPCR are specific to double-stranded products, a considerable amount of background fluorescence is commonly detected. This is also the case when sequence-specific probes are used, however, the background fluorescence might be at a lower level. It is therefore critical to surpass the basal level of the fluorescent signal in order to quantify the amplification product correctly.
The threshold is defined as the fluorescence level above background at which a signal can be detected. The Cq value is the PCR cycle number at which your sample’s fluorescence curve reaches the threshold (Fig. 4). It therefore reflects the level of amplification that was required to detect the sample and as such it is inversely correlated with the amount of template inserted into the reaction.
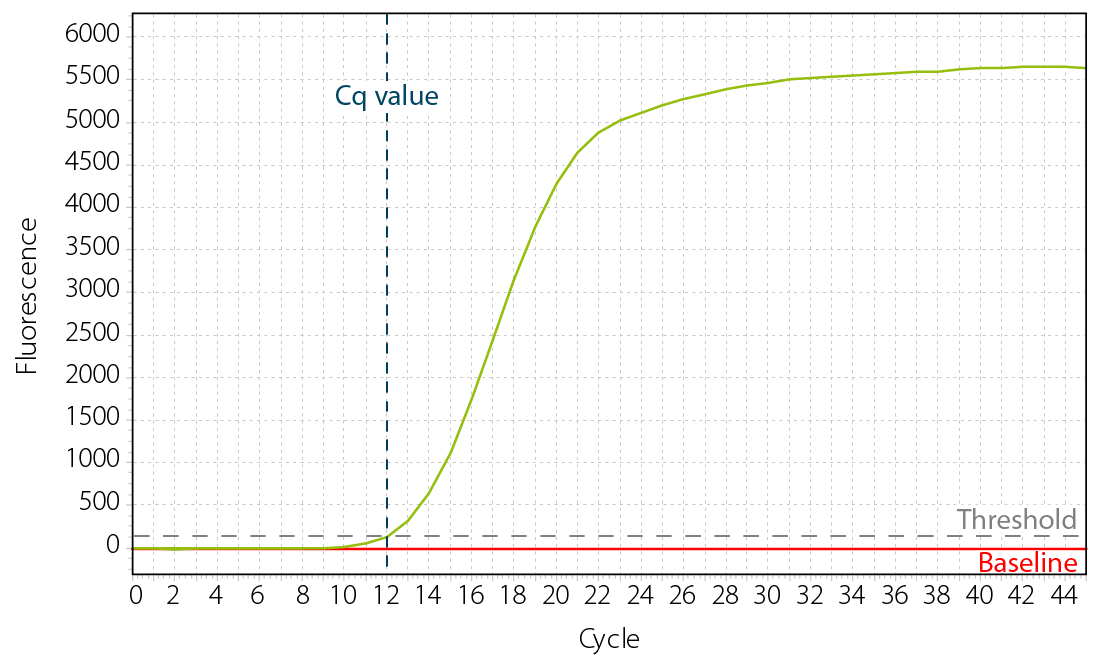
Figure 4 | Cq value and threshold of a qPCR amplification curve.
Samples with low Cq values reach the threshold fast, i.e., they require a lower level of amplification to surpass the background as the concentration of the PCR template in the reaction was high to begin with. Samples with high Cq values required more rounds of exponential amplification and therefore contained less of the target molecules.
While delivering a more accurate quantification, these assays do not supply the user with information regarding library size distribution. Unwanted side-products such as linker-linker artifacts are not discernible from the actual library in the qPCR assay as both will be amplified.
Also, qPCR assays rely on intercalating dyes for quantification, such as SYBR Green I or EvaGreen. These dyes interact non-specifically with double-stranded nucleic acids. The signal strength is proportional to the length of the double-stranded molecule, i.e., the longer a double-stranded fragment, the more dye molecules can bind and interact with it and the stronger the signal will be for this specific library fragment. As a consequence, accurate quantification also requires normalization of the estimated molarities according to the average library lengths. It is therefore highly recommended to combine such an assay for quantification with microcapillary electrophoresis analysis for library size distribution and assessment of by-products that would influence the measurement.
Apart from using qPCR to quantify the final library, the qPCR assay is also a useful tool to quality control the workflow during library preparation, especially when using low input RNA or single-cell library preps where the input cannot undergo quality control as described in Chapter 4.
3. qPCR for Quality Control during Library Generation
Having covered post-library preparation quality control mechanisms, we will briefly focus on quality control steps that can be used during library generation to make sure libraries of the highest possible quality are obtained. In Chapter 4 and Chapter 5 we have discussed how microfluidics assays are used to assess the quality of the RNA after extraction and how genomic DNA can be detected in your sample.
Apart from RNA quality control, qPCR is used as a tool to control any pre-processing steps, such as mRNA-selection and rRNA depletion and the subsequent library generation steps. It helps to assess the efficiency and consistency of the individual processing steps, i.e., technical replicates should show the same Cq / Ct values and behave identically. Large variations between technical replicates thus point to inconsistencies in handling, environment, or the protocol itself.
For long-term and large-scale experiments, or experiments that use very similar RNA input from the same source, a qPCR assay is only needed to establish the optimal cycle number during the setup of the procedure. Further experiments using the same overall sample and input conditions can reliably use this optimal cycle number without the need to repeat the qPCR assay for each new set of library preparations.
4. qPCR as Important Checkpoint for Library Generation from Ultra-low Input RNA and Single Cells
For library preparation from single cells or ultra-low input RNA, performing qPCR during the library generation process is one way to assess the quality and quantity of the input prior to analysing the final library traces. The RNA content from these samples is too low to be detected by any other means, therefore, RNA quality control mechanisms cannot be used.
Single-cell protocols that use PCR to generate amplified cDNA prior to library conversion by a DNA library prep offer the possibility to run the amplified cDNA on a microfluidics instrument for quality control. Many of these protocols additionally recommend cDNA quantification by qPCR to determine the appropriate input amount for the subsequent DNA library preparation.
The qPCR quantification during library generation is also used to determine the optimal number of PCR cycles for library amplification (see below).
5. Why Less is more: Using qPCR Assays for Optimal Cycle Number Determination
As only a very small proportion of library fragments is finally sequenced (see Chapter 2), all sequencing workflows possess an inherent sampling bias. Further, PCR reactions generate more errors and artifacts when a high number of cycles is applied, as the reaction runs out of critical components by depleting the individual nucleotides unevenly and primers becoming scarce (see Chapter 7 for more details). A higher library concentration is therefore often a trade-off with quality / complexity (low duplication rate) and accuracy (low error rate).
Adaptation of the PCR cycle number is necessary to account for the varying content of amplifiable target sequences in the samples, e.g., when working with samples from different sources or samples of heterogenous quality, such as intact and degraded or FFPE samples. Choosing an incorrect cycle number can either lead to insufficient amplification (termed undercycling) or to excessive amplification (termed overcycling).
Undercycling generates libraries with yields that are too low for accurate quantification, size estimation, or lane mixing. The yield of these libraries can be increased by adding additional PCR cycles – however, this uses additional resources and can introduce further bias and loss in complexity. Overcycling is characterized by formation of aberrant products due to exhaustion of reaction components, which impact accurate quantification, and reduce data quality.
Overcycling occurs during the plateau phase of PCR. Reaction components and primers become scarce and heteroduplex products are generated. Each library molecule in the reaction is tagged with the Illumina-compatible adapter sequences. While the insert sequences are variable, the adapters on one molecule are complementary to the adapter sequences flanking any other molecule in the reaction. As a result, adapter sequences can anneal between different library molecules and thus form partially complementary heteroduplex structures. These so called “bubble products” contain double-stranded regions on either end made up by the Illumina-adapters and a non-complementary partially single-stranded bulge corresponding to the insert fragment, the “bubble” (Fig. 5).
During the exponential phase of PCR, heteroduplex formation is prevented, as amplification primers block the adapter regions and mis-annealing to another library molecule is thwarted (Fig. 5).
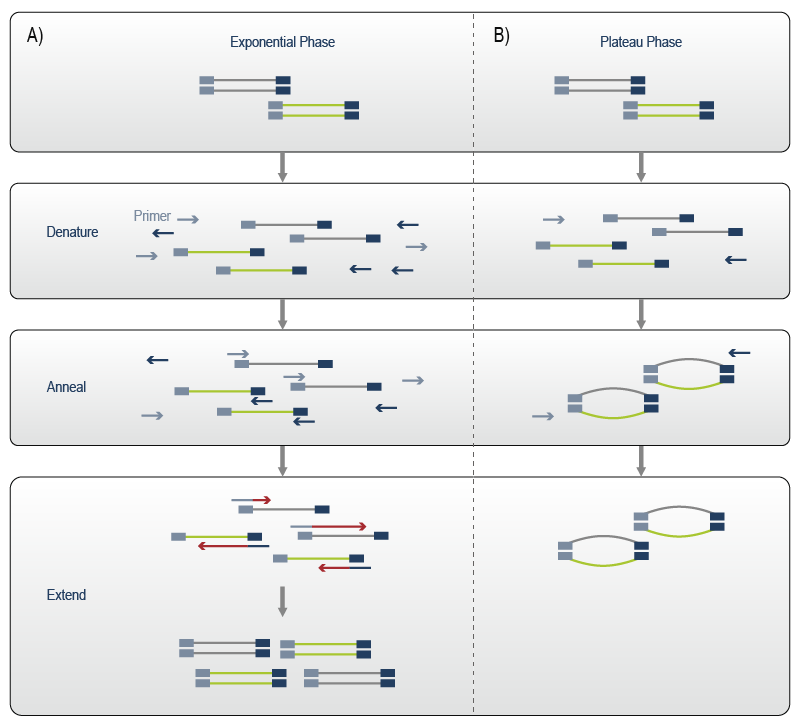
Figure 5 | Formation of aberrant PCR products. A) PCR during exponential amplification phase: double-stranded DNA libraries are denatured, primers are annealed and extended to complete the complementary strand. Then, a new cycle is started. B) When primers are depleted, complementary adapter sequences can anneal to each other generating bubble products. Adapted from Illumina.
When aberrant bubble products occur as a consequence of overcycling, a characteristic high molecular weight “bump” becomes visible when analyzing the affected library traces (Fig. 6). While these libraries are still sequenceable, quantification is impaired often causing unequal read distribution between samples.
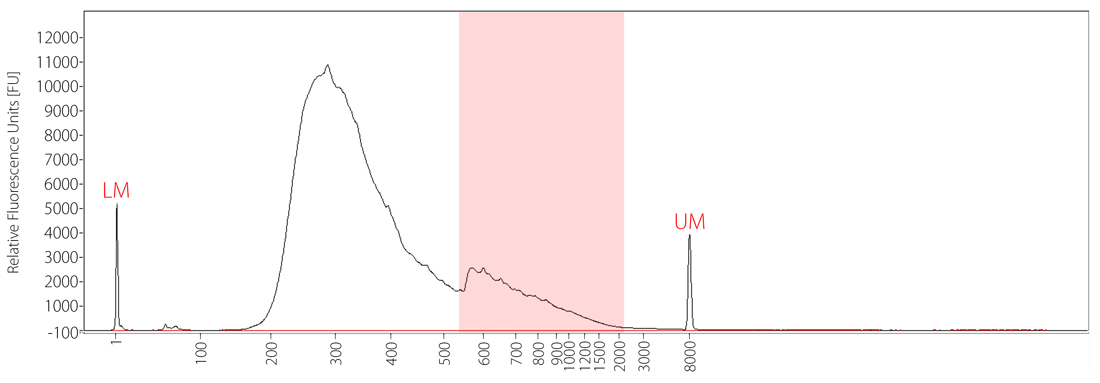
Figure 6 | Fragment Analyzer trace for an overcycled library showing a characteristic bubble product.
Overamplification leads to higher duplication rates, potentially reduced complexity, and higher sampling variance. In the worst case, the data obtained from a sequencing experiment can be distorted. The variability between replicates can thus be increased so much that the data set loses its usefulness. Correct data interpretation can be extremely challenging and dominated by large effects that are brought about by PCR artifacts – in the worst case, leading to incorrect biological conclusions. For more details also see our blog article on library amplification and cycle number determination. By using an inexpensive qPCR assay to determine the optimal PCR cycle number, researchers can avoid these pitfalls and ensure the best results for their sequencing experiments.
Are you ready to become an RNA Expert?
Sign up and gain access to helpful checklists in PDF format that can assist you in your experiments. In addition, you’ll have the opportunity to download the RNA LEXICON E-BOOK in PDF format as well.