Single-cell RNA-Seq has revolutionized the field of transcriptomics, providing unprecedented insight into cellular complexity and heterogeneity. In our first blog post of the RNAEXPERTise Blog Series on Single-Cell RNA-Seq – “Classical Single-Cell RNA Sequencing: a comprehensive overview,” we talked about the basic principles, benefits, and most common applications of classical single-cell RNA-Seq.
In this blog article, we want to point out one of the major pitfalls of the classical single-cell RNA-Seq methods and introduce an alternative approach that helps overcome this problem.
What is a major limitation of the classical single-cell RNA-Seq?
The main limitation of the classical single-cell RNA-Seq methods is their limited sensitivity – decreased ability to detect all the transcripts in the sample owing to a failure in capture/amplification.
A typical single-cell RNA-Seq experiment consists of isolating single cells, followed by library generation and sequencing. The sensitivity of scRNA-Seq approaches is limited by the amount of RNA that can be extracted from single cells, which is typically between 1-50 pg – depending on the cell type. Sensitivity is compromised due to low input RNA, and combined with multiple library preparation steps (Zheng et al., 2017) (reverse transcription, template switching, tailing, and ligation), losses (so-called drop-outs) occur, which reduce the detection limit. The reverse transcription step (during which conversion of mRNA molecules to cDNA happens) incredibly impacts sensitivity due to low conversion efficiency (Zheng et al., 2017). As a result, only data from highly expressed genes are reproducible.
To compensate for low mRNA conversion rates and to increase sensitivity, existing classical single-cell RNA-Seq methods (e.g., Chromium from 10xGenomics) rely on a high-throughput approach, sequencing thousands of cells at low (shallow) read depths. This high-throughput approach is sufficient for cell type identification based on detecting highly expressed signature genes. However, because it provides an incomplete picture of expressed genes by not capturing low-copy genes, this approach cannot allow us to understand cellular function or accurately characterize cell subpopulations fully.
Furthermore, increasing the sensitivity of single-cell RNA-Seq methods to the subcellular level would allow us to understand transcriptome properties and dynamics better. Recent studies (Ziegenhain et al., 2017) suggest that our view of transcriptomic “noise” and its threshold may need to be redefined, as expression events previously classified as noise may contribute to cell vitality. Ultra-sensitive methods can significantly expand our understanding of fundamental biological processes at a subcellular level.
This is precisely where High-Definition single-cell RNA sequencing (HD scRNA-Seq) comes into play.
What is High-Definition single-cell RNA Sequencing (HD scRNA-Seq)?
Mammalian cells typically contain 200k – 500k mRNA molecules (Shapiro et al., 2013), with most expressed genes represented only in a few copies (also demonstrated on Figure 3). The in-depth measurement of transcripts and their copies requires highly efficient library preparation methods and deep sequencing, due to the random sampling of sequencing reads, even after unbiased library amplification methods (Svensson et al., 2017; Ziegenhain et al., 2017). Transcripts present in low-copy numbers are usually sparsely represented (if any) due to limited sensitivity of scRNA-Seq protocols, and dominance of highly abundant transcripts at limited, shallow sequencing depths.
To overcome the hurdle of having to sequence large numbers of cells to achieve sufficient sensitivity, Lexogen has developed a technology that enables 3′ mRNA-Seq even from challenging ultra-low input samples. By capturing not only highly abundant genes, but also those lowly-expressed, this technology, called THOR (T7 High-resolution Original RNA amplification) allows in-depth analysis of the transcriptome profile of individual cells and gives access to the complete gene expression signatures. To illustrate the ability of the technology to capture even low-expressed transcripts with greater accuracy, we have coined the term High-Definition Single-Cell RNA-Seq (HD scRNA-Seq), for scRNA-Seq performed using THOR technology.
We have recently released LUTHOR High-Definition Single Cell 3’ mRNA-Seq Kit (LUTHOR HD), our groundbreaking product based on THOR technology, and pioneer of High-Definition Single-Cell RNA-Seq, enabling researchers to unravel the complete transcriptome of each individual cell.
The THOR technology
Classical scRNA-Seq library preparation methods start with reverse transcription of RNA into cDNA, followed by exponential amplification by PCR. This initial reverse transcription step is one of the main culprits for decreased sensitivity due to low conversion efficiency (Zheng et al., 2017).
Driven by the desire to avoid this pitfall of immediate reverse transcription, Lexogen scientists designed the THOR amplification technology such that RNA copies are directly amplified from the original mRNA molecules found in individual cells, and only then reverse transcribed. As a result, more templates are available for the reverse transcription, ensuring that even low-expressed RNA molecules are captured.
So, how does THOR amplification work? In an initial priming step, a primer containing a poly(T), library-specific tags (UMIs), an adaptor and a T7 promoter is annealed to the 3′ end of single-stranded RNA. The generation of a double-stranded T7 promoter region at the 3′ end of single-stranded mRNAs allows the synthesis of antisense RNA copies directly from mRNA templates (in vitro transcription step). Since only poly(A)-tailed mRNAs are primed, there is no need for RNA extraction, poly(A) enrichment, or ribosomal RNA depletion (Figure 1). In the next step (not shown in Figure 1), the amplified RNA (aRNA) copies are reverse transcribed into cDNA using random primers and Lexogen’s proprietary Displacement Stop technology, and the resulting libraries are amplified by PCR.
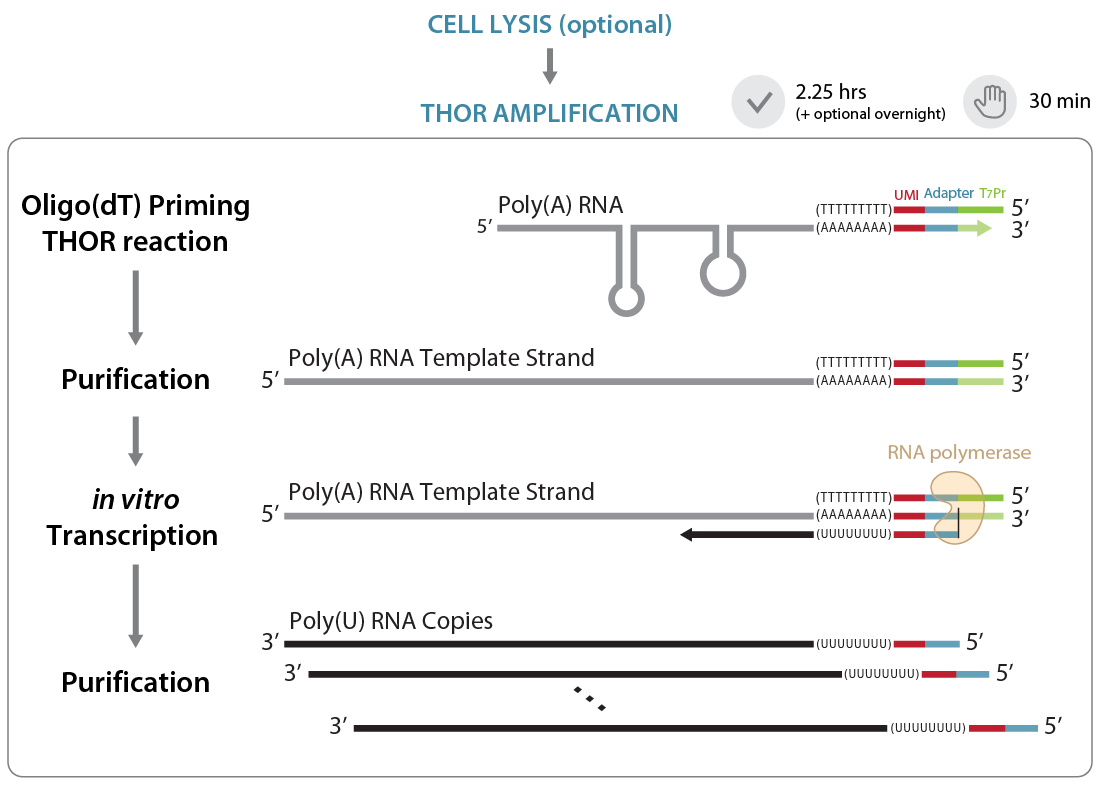
Figure 1 | Illustration of the THOR amplification. Gray: original RNA; black: amplified RNA (aRNA); red: UMI; light blue: P7 Illumina adapter; light green: T7 promoter.
By design, THOR technology avoids carry-over of genomic DNA. Figure 2 shows read statistics from an experiment where Luthor HD was used to generate sequencing libraries from single cells. The percentage of mapped reads indicates that, on average, approximately 80 % of the reads are from exonic regions, with the remaining reads split between intronic regions, intergenic regions and ribosomal RNA (rRNA) (Figure 2). This is a very valuable feature of Luthor HD, as it saves on read costs and simplifies data analysis.
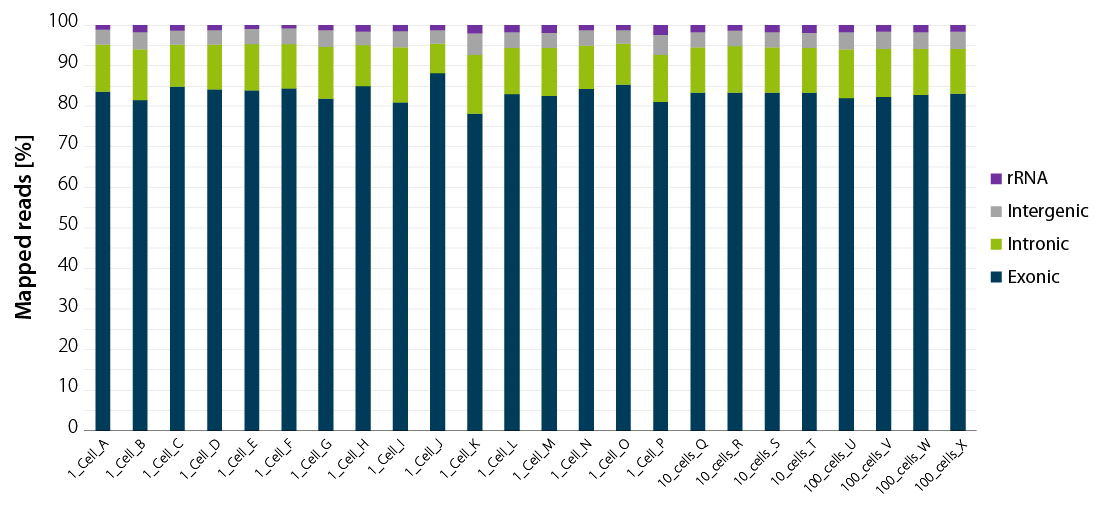
Figure 2 | Luthor HD NGS read statistics. Horizontal stacked bar graph shows sequencing alignment metrics across 16 single DU145 cells (named A to P), 4 groups of 10 cells (named Q to T), and 4 groups of 100 cells (named U to X), freshly isolated by flow-cytometry-assisted sorting and immediately lysed in LUTHOR HD Cell Lysis Buffer (CLB). Read depth per library ranges from 0.44 to 1 M reads (1 cell), 0.78 to 1 M reads (10 cells) and 0.80 to 1 M reads (100 cells). Total mapped reads percentages are split into exonic, intronic, intergenic, and rRNA reads.
Gene detection vs Transcript expression - and why it matters?
Gene and transcript detection concepts are often interchangeably used when discussing the detection power or sensitivity of single-cell RNA-Seq methods. To demonstrate why one needs to be precise when using these terms, we have plotted the expression level of genes and their corresponding transcripts (gene-based UMI-collapsed transcripts or UMI-counts) in a single cell and grouped them by the magnitude of the mean expression level per cell (Figure 3). As many as 50 % of genes contain less than 10 transcript copies (so-called lowly-expressed genes), and these are precisely the ones that would have a much lower chance of being picked up by less sensitive scRNA-Seq approaches.

Figure 3 | Expression levels of genes and their corresponding transcripts in single cells. The relative number of genes and their corresponding transcripts are grouped by the magnitude of the mean expression level per cell. The bars show the calculated fraction using uniquely mapping reads only, while the dashes mark the shares counting also multimapping reads averaged by the number of mapping positions. Dots depict uniquely mapping and multimapping reads summed up over all mapping positions respectively.
Sequencing depth, input, limit of detection, and sensitivity of HD scRNA-Seq
How many reads do I need for my RNA-Seq experiments? This a question that we get very often from our customers, but it is not an easy one to answer, so we have dedicated an entire blog post to the topic of sequencing depth in bulk RNA-Seq. Regarding scRNA-Seq, sequencing depth is an equally important topic, as it will undoubtedly influence the detection limit and, thus, the amount of information one can retrieve from the experiment. Important to have in mind is that the amount or depth of information required to gain from an experiment depends very much on the research question, as you will need more or less detailed information to answer it.
Based on our results with the LUTHOR HD kit, one can estimate to require approximately 1 M raw reads to detect about 95 % of the expressed genes, and around 5 M raw reads for 95 % of the transcripts. Highly efficient library preps require equally high sequencing depths to resolve complete single cell gene expression signatures (Svensson et al., 2017; Ziegenhain et al., 2017). In addition, input (number of cells or amount of RNA) will dictate the detection limit too, which is why classical scRNA-Seq methods focus on sequencing large numbers of cells (thousands of cells) at lower sequencing depths, to boost sensitivity, while still being more-or-less cost-effective. Yet, that is often not enough to tackle the true cellular heterogeneity.
We have put LUTHOR HD, our pioneering HD scRNA-Seq 3′ mRNA-Seq library prep kit, to the “sensitivity” test, using both dilution series of total RNA (1- 40 pg) isolated from DU-145 human prostate cancer cells and single DU-145s isolated via fluorescence-activated cell sorting (FACS) (Figure. 4). Sequencing was done at 5 M raw reads per sample, and we have plotted gene detection (Figure 4a) or transcript detection (Figure 4b) at different sequencing (read) depths.
Figure 4 | Gene and transcript detection sensitivity, and gene detection overlaps at different sequencing depths. a. Number of detected genes and b. gene-based collapsed UMIs (transcripts) at different read depths are shown for single DU-145 cells (region covered by 8 cells), together with means of no input control (NIC), and of 1 to 40 pg total RNA purified from DU-145 cells.
At a read-depth of 1 M reads, LUTHOR HD detected 12,000 genes at the single cell level and 2,000-3,000 genes from ultra-low RNA input (1 pg) (Figure 4a). This demonstrates the power of HD scRNA-Seq, and its ability to provide information depth necessary for high-definition gene expression profiling, and even in the case of very limited (minimal) input RNA. Interestingly, if we look at the gene detection plot (Figure 4a), we will not see a difference in detected gene rates between small and large FACS-sorted cells (indicated as large=small on the graph). However, if we look at the rates of transcript detection (Figure 4b), there is a clear difference depending on the cells size, indicating that Luthor HD’s sensitivity can capture the true cellular transcript diversity. Clearly, HD scRNA-Seq is a method of choice for those interested in confidently discovering cellular heterogeneity.
High sensitivity and “less-than-a-cell” input
A typical mammalian cell contains approximately 10 pg – 30 pg of total RNA (Han and Lillard, 2000; Tang et al., 2011). We wanted to test the sensitivity of Luthor HD’s on ultra-low inputs of RNA, which would correspond to a “less-than-a-cell” input. To do this, we performed an experiment where we diluted RNA purified from human Panc-1 cells, so that we had 10 pg, 1.25 pg, 0.6 pg, 0.3 pg, and 0.15 pg of RNA per sample, and we looked at the average genes detected for those amounts of RNA, sequencing at 5 M reads (Figure 5). Even at 0.15 pg (roughly 1/100th of a cell-equivalent) we can still detect thousands of genes. This opens the door to a potential application of Luthor HD and HD scRNA-Seq to cutting-edge approaches such as cytoplasmic extractions of RNAs from live cells.

Figure 5 | Average number of genes detected for 10 pg, 1.25 pg, 0.6 pg, 0.3 pg, and 0.15 pg of RNA dilutions (purified RNA from human Panc-1 cells). LUTHOR HD libraries, CPM > 1.
At a read-depth of 1 M reads, LUTHOR HD detected 12,000 genes at the single cell level and 2,000-3,000 genes from ultra-low RNA input (1 pg) (Figure 4a). This demonstrates the power of HD scRNA-Seq, and its ability to provide information depth necessary for high-definition gene expression profiling, and even in the case of very limited (minimal) input RNA. Interestingly, if we look at the gene detection plot (Figure 4a), we will not see a difference in detected gene rates between small and large FACS-sorted cells (indicated as large=small on the graph). However, if we look at the rates of transcript detection (Figure 4b), there is a clear difference depending on the cells size, indicating that Luthor HD’s sensitivity can capture the true cellular transcript diversity. Clearly, HD scRNA-Seq is a method of choice for those interested in confidently discovering cellular heterogeneity.
HD scRNA-Seq, Live-seq and cytoplasmic extracts
Live-seq (Chen et al., 2023) is a single-cell transcriptome profiling method based on sampling picoliters of cytoplasm from the same cell while keeping it alive, enabling time-resolved transcriptomics. The approach is revolutionary because it opens the possibility to profile the transcriptome of individual single cells before and after a stimulus and record transcriptional changes over time. However, there are several important prerequisites for the success of this method, namely:
a) reliable, repeated sampling of picoliter-amounts of cytoplasmic extracts, and
b) generation of high-quality transcriptomic profiles from very limited amounts of RNA, in the range of 1 pg or lower.
To explore the application of Luthor HD for gene detection from cytoplasmic extracts, Lexogen partnered with Cytosurge, an innovative company developing solutions for gentle and precise collection of cytoplasmic biopsies. Cytosurge has developed a biopsy platform (FluidFM OMNIUM) that allows selection of specific individual cells based on their phenotype and performs cytoplasmic extractions for downstream transcriptome analysis, without requiring cell lysis, fulfilling one of the requisites for Live-seq. Currently, our collaboration is focused on adapting the Luthor HD approach to cytoplasmic biopsies, and developing a robust and sensitive protocol to support Live-seq. We expect that the adapted Luthor HD will increase the sensitivity and resolution of Live-seq biopsies and significantly increase the detection capability of Live-seq (currently at around 1,000-1,500 genes), enabling the application of both technologies in biomedical research.
References
Chen, X., Hudson, G.A., and Mineo, C.; Amer, Bashar; Baidoo, Edward E. K.; Crowe, Samantha A.; Liu, Yuzhong; Keasling, Jay D.; Scheller, Henrik V.202314 (2023). Deciphering triterpenoid saponin biosynthesis by leveraging transcriptome response to methyl jasmonate elicitation in Saponaria vaccaria. Nature Communications 14, 7101. DOI: 10.1038/s41467-023-42877-0.
Han, F., and Lillard, S.J.200072 (2000). In-situ sampling and separation of RNA from individual mammalian cells. Analytical chemistry 72, 4073-4079. DOI: 10.1021/ac000428g.
Shapiro, E., Biezuner, T., and Linnarsson, S.201314 (2013). Single-cell sequencing-based technologies will revolutionize whole-organism science. Nat Rev Genet 14, 618-630. DOI: 10.1038/nrg3542.
Svensson, V., Natarajan, K.N., and Ly, L.-H.; Miragaia, Ricardo J.; Labalette, Charlotte; Macaulay, Iain C.; Cvejic, Ana; Teichmann, Sarah A.201714 (2017). Power analysis of single-cell RNA-sequencing experiments. Nature Methods 14, 381-387. DOI: 10.1038/nmeth.4220.
Tang, F., Lao, K., and Surani, M.A.20118 (2011). Development and applications of single-cell transcriptome analysis. Nat Methods 8, S6-11. DOI: 10.1038/nmeth.1557.
Zheng, G.X.Y., Terry, J.M., and Belgrader, P.; Ryvkin, Paul; Bent, Zachary W.; Wilson, Ryan; Ziraldo, Solongo B.; Wheeler, Tobias D.; McDermott, Geoff P.; Zhu, Junjie, et al.20178 (2017). Massively parallel digital transcriptional profiling of single cells. Nature Communications 8, 14049. DOI: 10.1038/ncomms14049.
Ziegenhain, C., Vieth, B., and Parekh, S.; Reinius, Björn; Guillaumet-Adkins, Amy; Smets, Martha; Leonhardt, Heinrich; Heyn, Holger; Hellmann, Ines; Enard, Wolfgang201765 (2017). Comparative Analysis of Single-Cell RNA Sequencing Methods. Molecular Cell 65, 631-643.e4. DOI: 10.1016/j.molcel.2017.01.023.
Written by Masa Ivin, PhD