A software tool for the accurate estimation of RNA concentration from RNA-Seq data.
Model
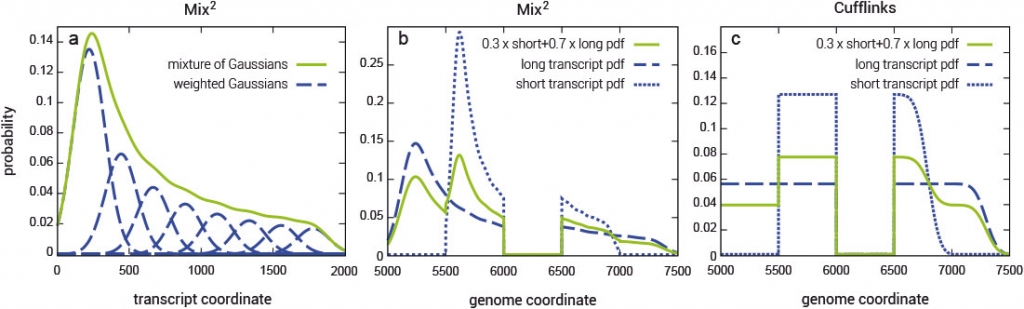
Fragment bias in RNA-Seq poses a serious challenge to the accurate quantification of gene isoforms. Mix² makes no assumptions about coverage bias but fits for each gene isoform a mixture model to the data (Fig. 1). Mix² can therefore, for instance, accurately represent the 5’ bias, as shown in Fig. 1 (a and b), whereas Cufflinks is restricted to the uniform distribution (Fig. 1c).
Figure 1 | Exemplary representation for positional fragment bias over a 2000 bps transcript modeled with a mixture of 8 normal distributions. (a) the green curve shows the combined probability density function over the whole transcript, while the blue curves show the individual mixture distributions. (b) and (c) panels display fragment distributions in a locus with two transcripts sharing one junction, as modeled by Mix² or Cufflinks. Long and short transcripts start at 5000 and 5500 bp from the beginning of the locus, and are 2000 and 1000 bp long, respectively. The junction spans the 6000 – 6499 bp region.
The Mix² software yields accurate isoform quantification from RNA-Seq data
Implementation and run-time performance
The Mix² software runs as a 64-bit Linux command line tool. For an up-to-date list of supported distributions please refer to the User Guide of the Mix² software.
Mix²
Cufflinks w/o bias correction
Cufflinks with bias correction
Dataset
Min
GB
Min
xRT
GB
xMEM
Min
xRT
GB
xMEM
Avg(UHR)
7
1.26
34
4.9
0.99
0.79
542
77.4
1.32
1.05
Avg(HBR)
5
1.02
32
6.4
0.90
0.88
536
107.2
1.22
1.20
Table 1 | Memory usage and average run-time statistics on the MAQC UHR and HBR datasets. Min stands for run-time in minutes, GB for memory usage in gigabytes. xRT and xMEM are the factors by which run-time and memory usage increases, respectively, in comparison to Mix².
Mix² was tested on the publicly available MicroArray Quality Control (MAQC) [1] and Association of Biomolecular Resource Facilities (ABRF) [2] datasets, containing RNA-Seq data from multiple sequencing facilities and library preparations which started with differently degraded RNA.
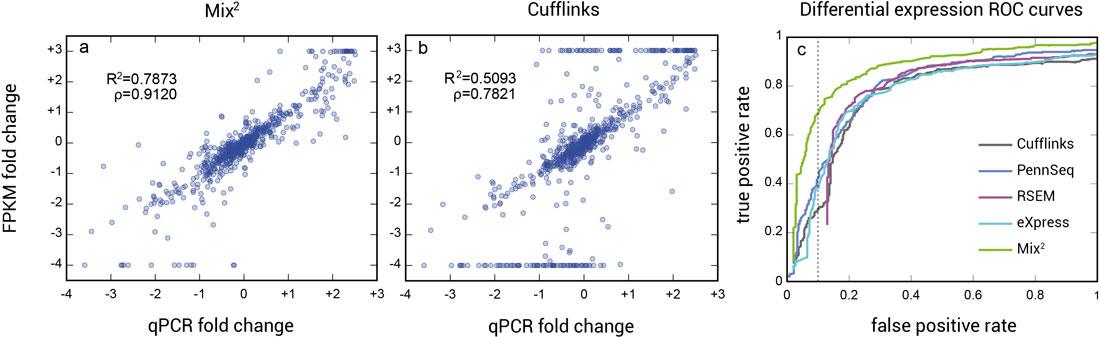
The higher accuracy of the concentration estimates of Mix² leads to better correlation between qPCR and FPKM fold-changes and consequently to higher accuracy in the detection of differential expression (Fig. 2).
Figure 2 | Correlation between qPCR and FPKM fold changes between UHR and HBR RNA for Mix² vs Cufflinks, and the ROC curve for a classification experiment based on FPKM values of UHR and HBR RNA lanes. Since the FPKM and qPCR fold changes should be identical, the range of FPKM fold changes was restricted to the range of qPCR values, as shown in (a) and (b), and thus to a range between 10-4 and 10-3. (b) Cufflinks produces a large number of transcripts whose FPKM fold change lies considerably above or below the majority, as can be seen by the long straight clusters at FPKM fold changes of 10-4 and 10-3. The Mix² model, on the other hand, greatly improves the correlation between qPCR and FPKM fold changes for the UHR and HBR RNA samples, and as shown in the classification experiment (c) leads to a substantially higher accuracy in the detection of differential expression. The dotted line in (c) indicates a false positive rate of 0.1.
FAQ
Frequently Asked Questions
Access our frequently asked question (FAQ) resources via the buttons below.
By clicking on "Accept All" you allow us to provide personalized content and ads, analyse usage statistics, and improve site functionality. Click "Accept All" to consent to these uses or click "Configure" to manage your cookie settings. You may change your cookie settings at any time.
Please choose which cookies you'd like to use.
Required
These cookies are required to provide core site functionality. These can't be disabled.
Analytics
These cookies allow us to analyse usage of our site so we can improve its performance.
Marketing
These cookies are used by advertisers to show you ads relevant to your interests.